Document Type : Original Article
Authors
1 Chemistry Department, Faculty of Science, Mansoura University, 35516-Mansoura, Egypt
2 Chemistry Department, Faculty of Science, Damietta University, Damietta, Egypt
Abstract
The redox mechanisms were examined for copper chloride in absence and presence of Orange G (OG) at 19.1°C using Carbon glassy electrode (CGE). The supporting electrolyte used is 0.1 M KCl effect of scan rate was also studies for the redox reactions for CuCl2 alone and in presence of the ligand used orange G (OG). Stability constants for the complex formed from the interaction of CuCl2+ Orange G (OG) were evaluated with the different thermo chemical data. Effect of different scan rates were examined for cupric Chloride in absence and presence of the ligand used Orange G (OG).The different scans used are 0.1, 0.05, 0.02 and 0.01 V/Sec. The stability constants and Gibbs free energies of complexation were also estimated for the interaction of CuCl2 with Orange G (OG) in 0.1MKCl supporting electrolyte.
Graphical Abstract
)
Keywords
Main Subjects
Introduction
Extraction of metal ions as pollutants from aqueous solutions using electrochemical methods is very interesting for environmental aim [1-6]. Several metal ions in solutions can be recorded and examined by the reduction of the different cathode materials [6,7].
In this work, estimation and electrochemical voltammetric analysis of copper ions in 0.1 M KCl was studied to explain the characteristics for evaluating it in the environmental samples. Bending copper with ligands is a treatment for remediation of Cu in vivo and vitro [7]. Long exposure to copper causes many problems, irritation in eyes, nose, mouth, causes headaches, dizziness, vomiting and diarrhea. High uptake copper causes kidney and liver damages [7].
Copper is vital dietary, small amount of metal is needed for well-being [8]. Copper [9] is most third abundant metal in the body [8-10].
In this work, estimation and electrochemical voltammetric analysis of copper ions in 0.1M KCl was studied for explaining the characteristics for evaluating it in the environmental samples.
Experimental
The used chemicals, CuCl2, KCl, are of high purity from Sigma Aldrich Co.Orange G (OG) is of the type Ranken (Ranbaxy). The volume of the experimental solution is 30 ml. Three electrodes cell was used to connect to potential DY 2000 Potentiostat , Ag /AgCl, KCl sat., reference electrode, carbon glassy electrode (CGE) was used as working electrode, platinum wire was also used as auxiliary electrode.N2 flow was done to ensure oxygen removal.The carbon glassy electrode (CGE) is prepared in our laboratory from pure carbon piece, polished with aluminum oxide on wool piece. Area of electrode is 0.502 cm2.
3. Results and discussion
3.1. Electrochemical behavior of CuCl2 in absence of Orange G (OG)
Studying the electrochemical behavior for CuCl2 in 0.1M KCl supporting at19.1oC was done in the range from +1V to -1V. In the range -1 to +1V oxidation took place, but scanning in the range of +1 and-1 permits and allows the copper reduction processes and ligand reduction.The change of Cu (II) to the Cu (I) state involves the reduction of metal ion radius [11]. Cyclic voltammogram between 1 and -1 V(Volt) show redox processes explaining C(II) / Cu(I) and Cu(I)/Cu(0) processes appearing in Fig.1.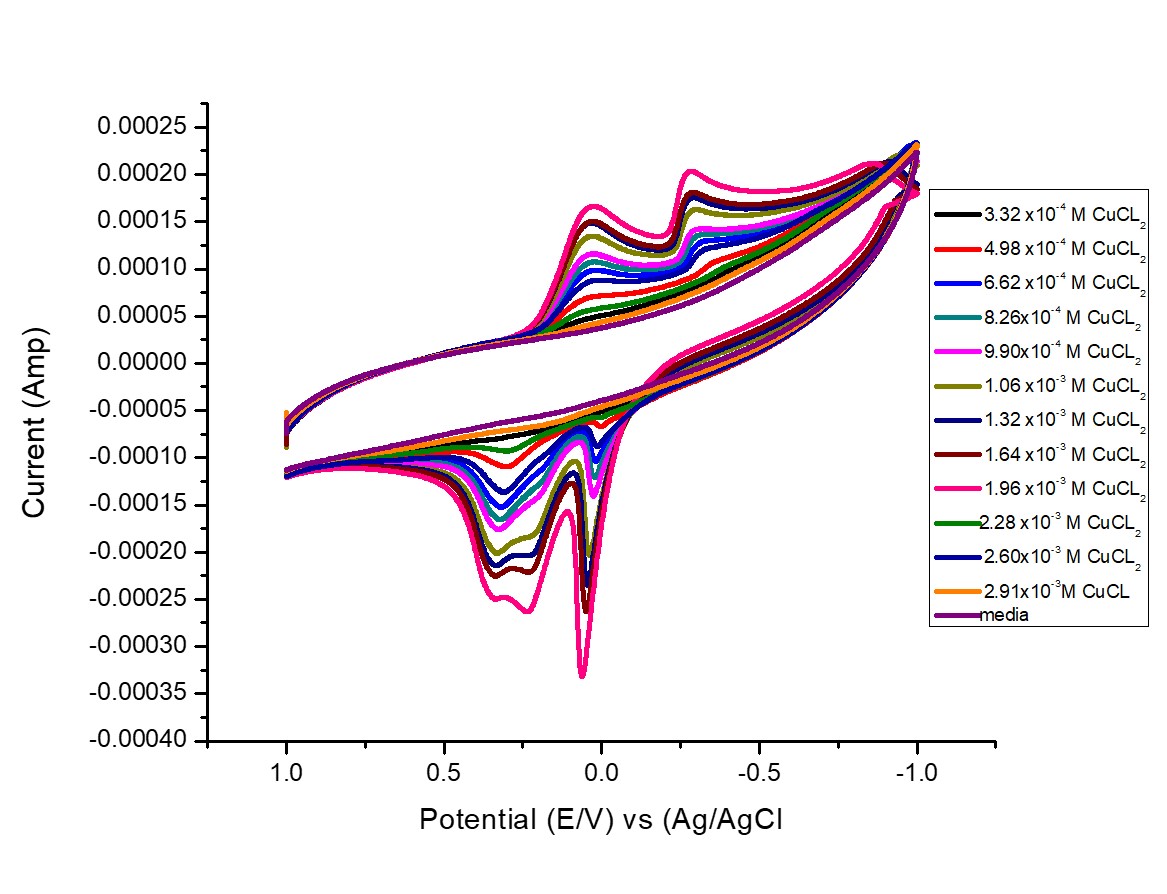
Fig. 1. Cyclic voltammograms of different concentration of CuCl2 in 0.1M KCl solutions at 19.1oC.
Scan rate was also studied for 6.62×10⁻⁴ M of CuCl2, at 0.01,0.02,0.05 and 0.1V/S, which are 100, 10, 20 ,50 mV/Second. All redox waves were appeared to increase with increasing scan rates as shown in Fig. 2.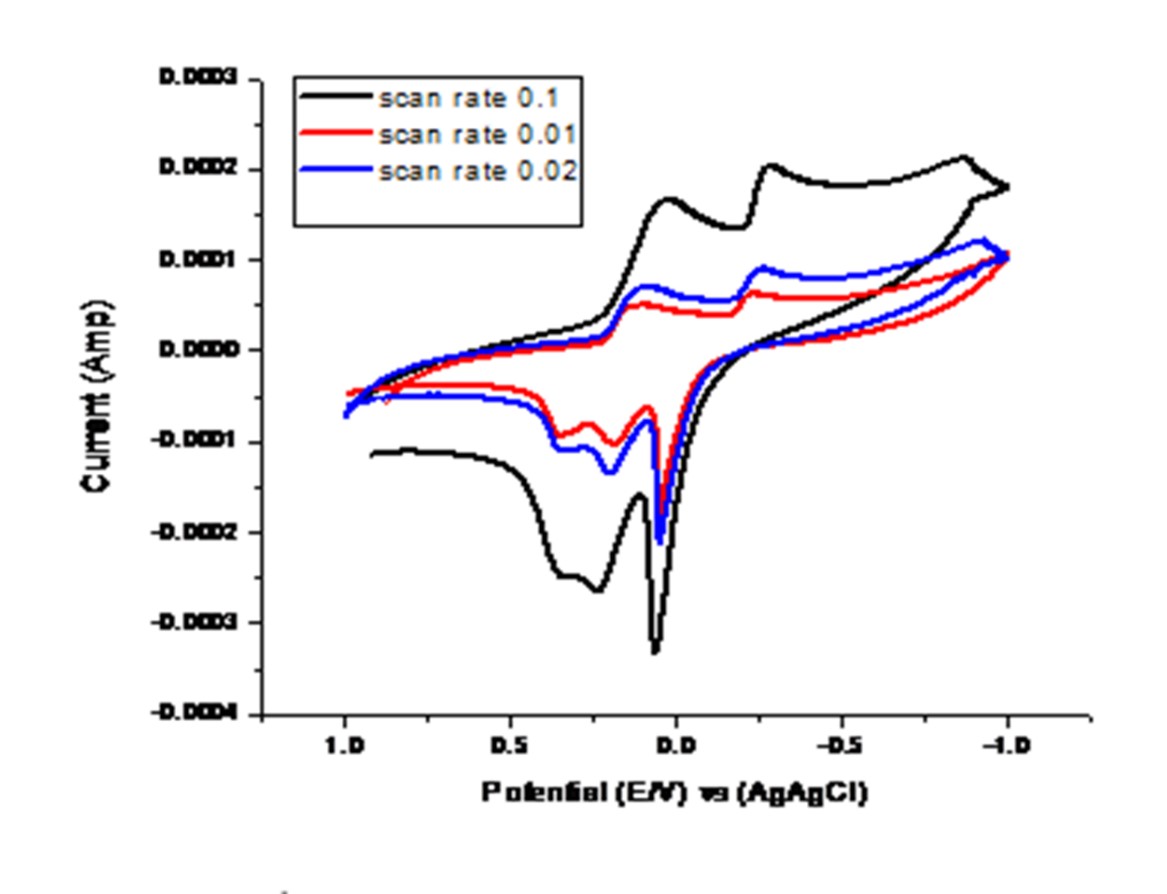
Fig. 2 Different scan rates of 6.62×10⁻⁴ M CuCl2 in 0.1M KCl at 19.1oC.
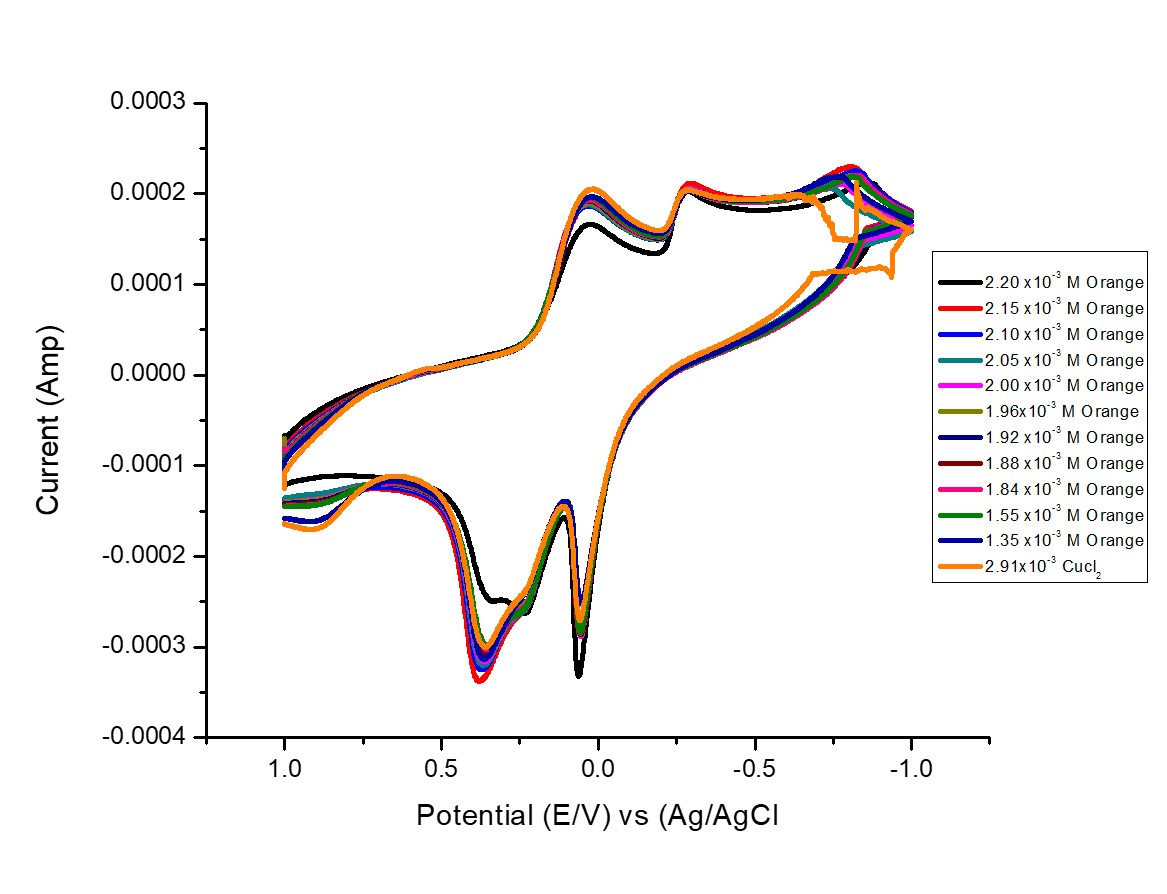
Fig. 3 Voltammograms of the interaction of different concentrations of Orange G (OG) with 1 mM CuCl2 in 0.1M KCl supporting electrolyte.
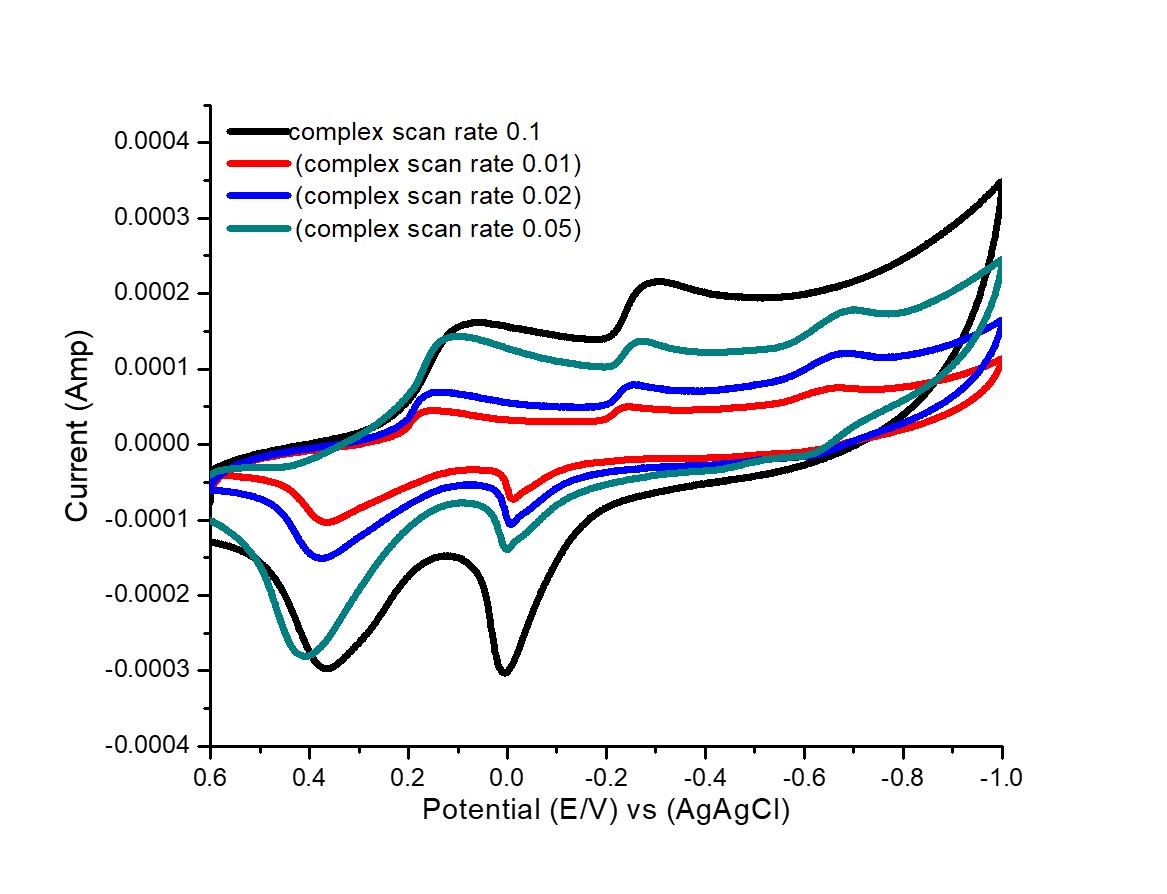
Fig. 4 Effect of different scan rates for 1:1 (Metal/OG) stoichiometries complexes.
Diffusion reactions are supported from the relation of an ip against v1/2.
3.2. Cyclic Voltammetry of CuCl2 in presence of ligand Orange G
The electrochemical behavior of the complex, formed from the interaction of CuCl2 with Orange G, was studied cyclic voltammetrically in the range of 1 to -1V. The potential reduction of Cu(II)/Cu(I) processes are studied. The electrochemical activity in the range studied showed pattern at all Cucl2 concentrations that may consider as the sum of individual processes [11-14].
[Cu (IIǀ) OG]+e- ⇄ [ Cu(I)OG] (1)
Diffusion controlled reaction are appearing and proved from the relation between ip and v1/2.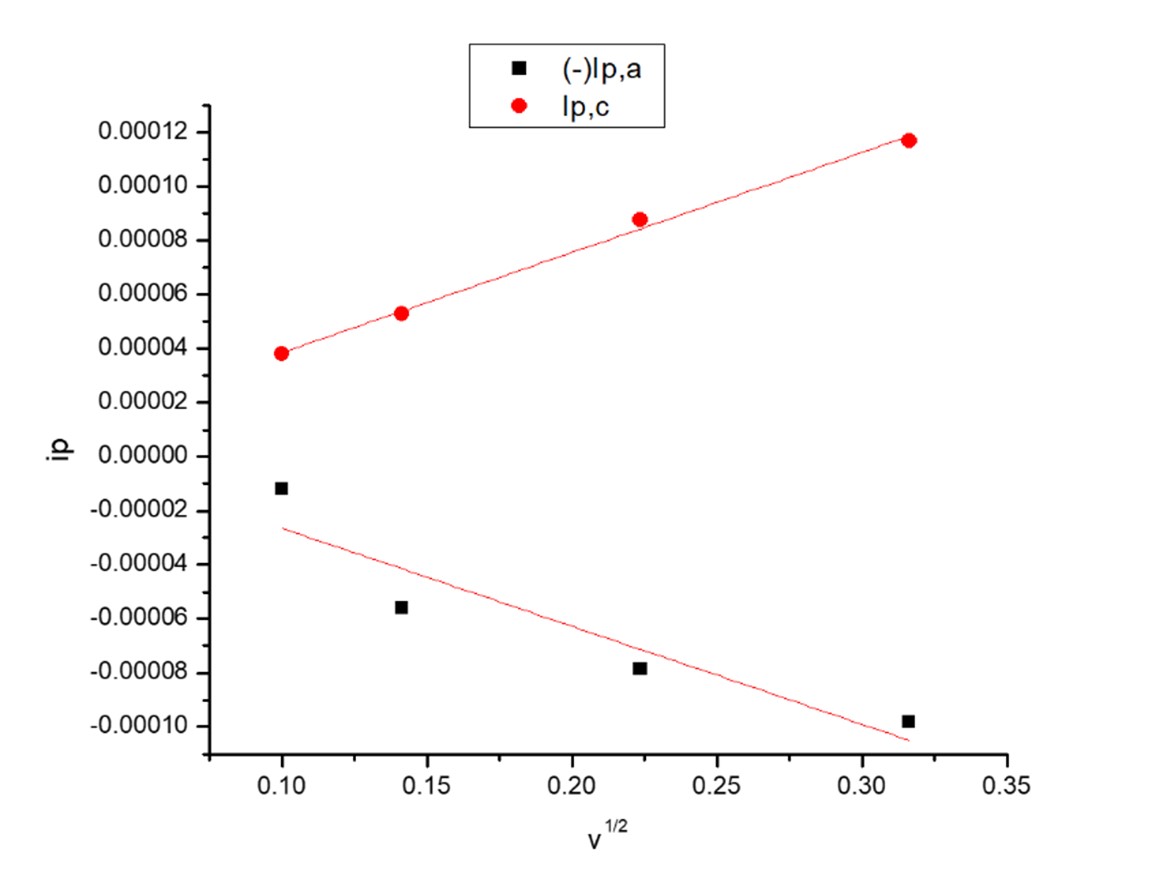
Fig. 5. The relation between ip and v1/2 for first redox couple waves in absence of (OG).
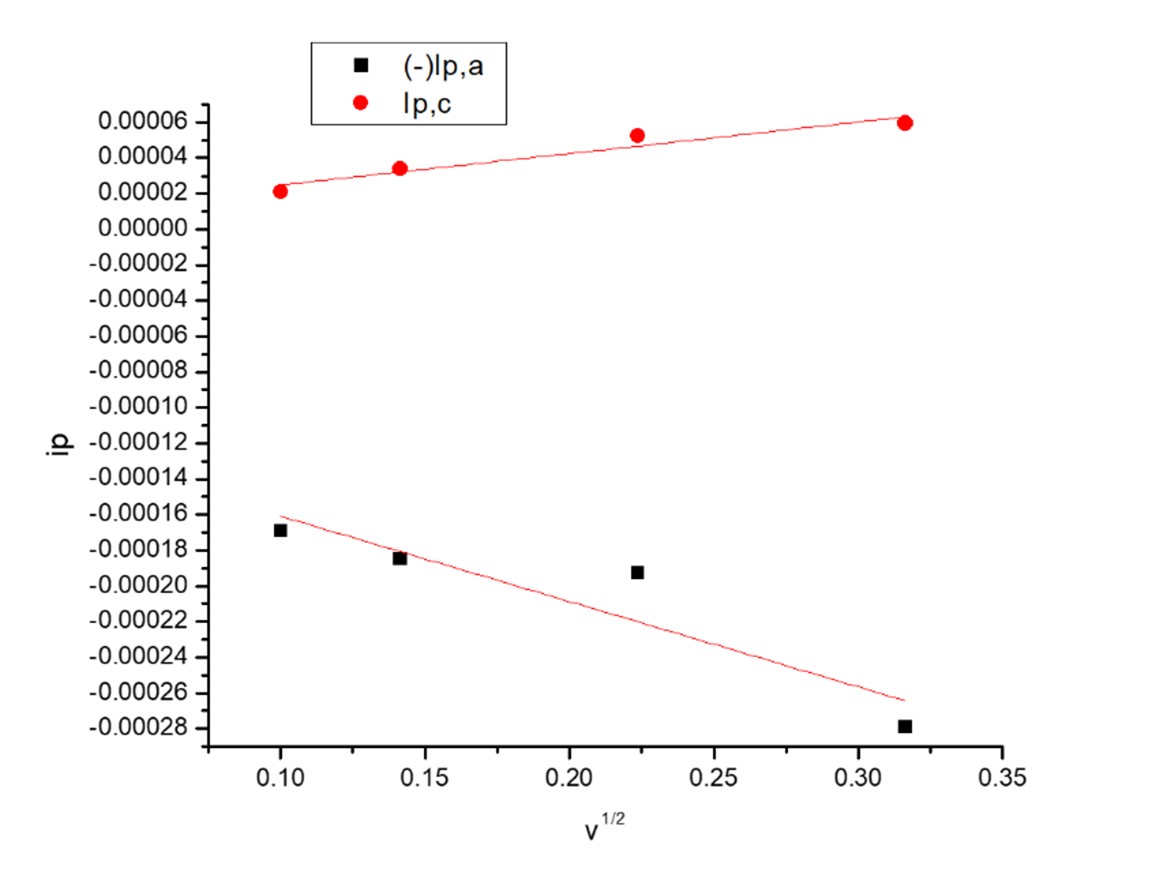
Fig.6. The relation between ip and v1/2 for second redox couple waves in the absence of (OG)
Voltammetric response of complexes explains the reduction and oxidation of metal centered processes.
Cyclic Voltammetry scanning of the complex formed from the interaction of CuCl2 with orange G (OG) between +1 and -1V (Volts) show two cathodic peaks and two anodic peaks.
The ratio between cathodic current of the peak and square root of scan (IPC/ν1\2) is approximately constant.
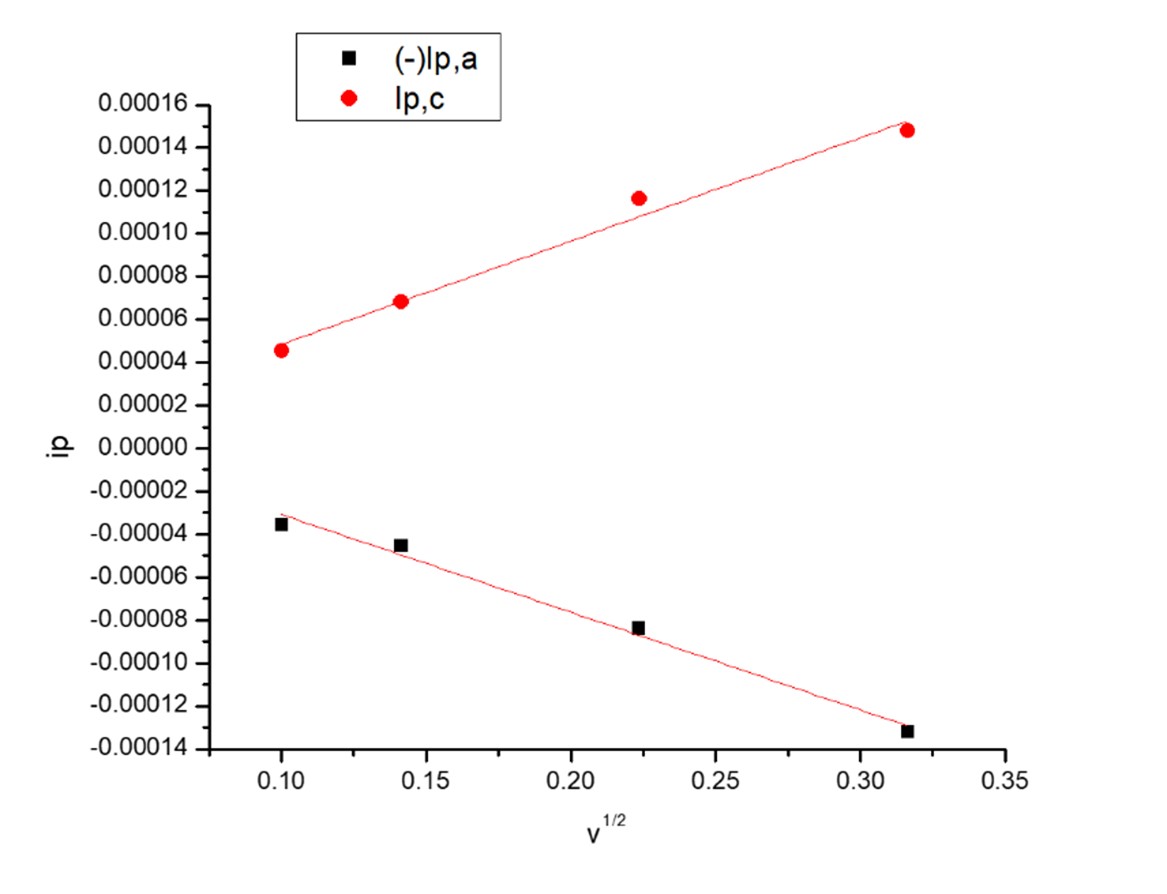
Fig. 7 The relation between ip and v1/2 for first redox couple waves in presence of (OG).
Reaction of CuCl2with gradual addition of ligand orange G (OG) was recorded until 1:3 (M/Ligand) molar ratio was reached.
Change in color and in electrochemical behavior was clear from the first addition. The changes increase when the ligand additions increase. Wave Cu (IIǀ)/Cu(I) complexes appears at higher concentrations of orange G (OG).
The relations between iP and v1/2 for CuCl2 solutions in the absence and presence of Orange G (OG) for the first copper ion couple of redox reactions and second couple of redox reaction gave straight lines proving the reversibility of the system studied, (Figs.5-8).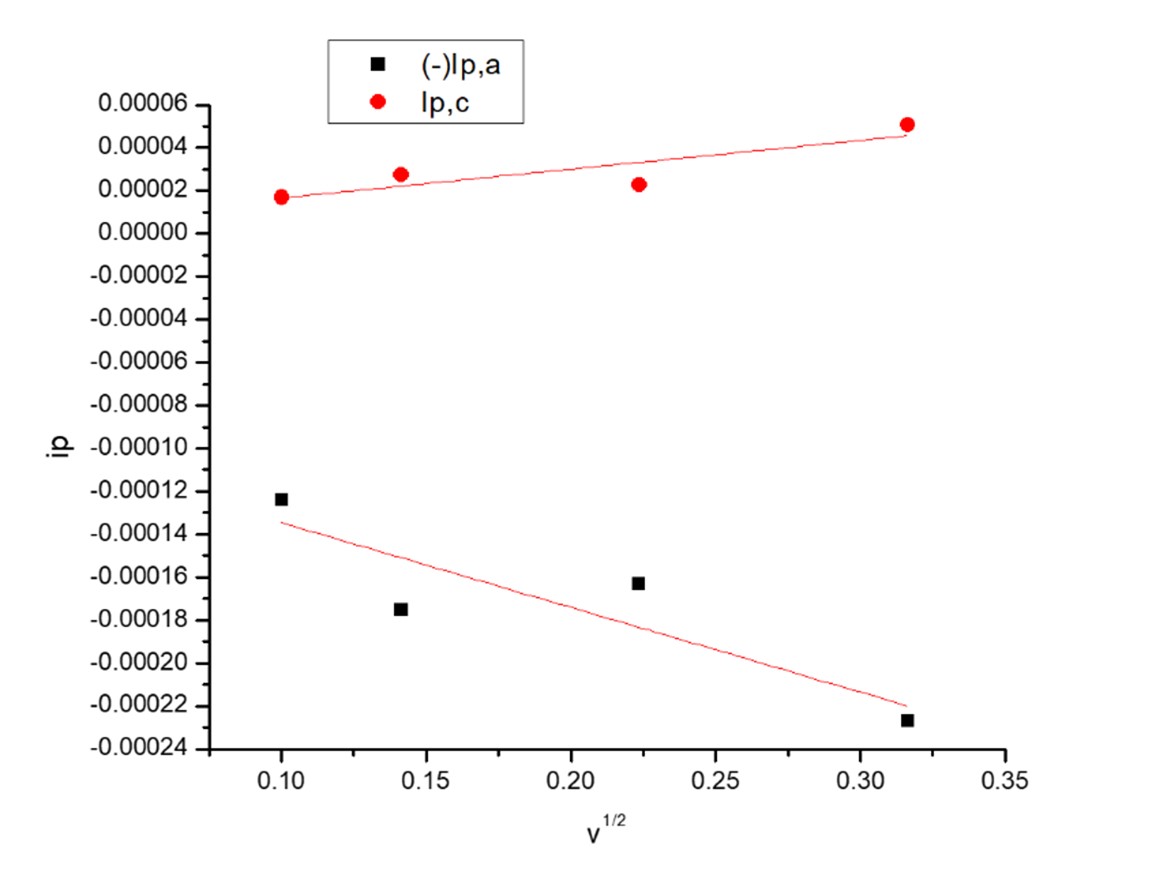
Fig. 8 The relation between ip and v1/2 for first redox couple waves in presence of (OG).
The equations used for the cyclic voltamogram (CV) analysis and further
calculations are explained in references [11-14].
Table1. Analysis data for the different cyclic voltammograms of copper chloride ions in absence of orange G (OG) in 0.1M KCl.
|
M |
EPa (V) |
Epc (V) |
∆EP |
ipa X10-5 (A) |
ipc X10-5 (A) |
ipa/ipc |
(-)Eo (V) |
Da X10-10 cm2.s-1 |
Dc cm2.s-1 |
(-)Epc/2 (V) |
αna |
Ks Cx10-4 cm.s-1 |
Γ Cx10-8 (mol.cm-2) |
(+) Qcx10-5 (C) |
Γ ax10-8 (mol.cm-2) |
(-) Q ax10-5 (C) |
|
6.62 |
0.0033 |
0.37 |
0.370 |
0.26 |
0.717 |
0.364 |
0.188 |
0.0215 |
0.16 |
0.34 |
1.84 |
9.41 |
0.2385 |
O.7.2 |
0.0869 |
0.264 |
|
99.0 |
0.0102 |
0.31 |
0.321 |
3.12 |
2.53 |
1.234 |
0.150 |
1.3703 |
0.90 |
0.27 |
1.43 |
12.0 |
0.8412 |
2.55 |
1.0383 |
3.15 |
|
13.2 |
0.0113 |
0.30 |
0.311 |
0.11 |
2.15 |
0.530 |
0.144 |
0.1031 |
0.36 |
0.27 |
1.93 |
8.05 |
0.7135 |
2.16 |
378.65 |
11.5 |
|
16.4 |
0.0173 |
O.20 |
0.313 |
5.90 |
2.35 |
2.51 |
0.13 |
1.7848 |
0.28 |
0.26 |
1.66 |
6.67 |
0.780 |
2.37 |
1.9620 |
5.94 |
|
19.6 |
0.0311 |
0.28 |
0.312 |
11.2 |
3.32 |
3.38 |
0.12 |
4.5219 |
0.39 |
0.25 |
1.83 |
8.24 |
1.102 |
3.34 |
3.7353 |
11.3 |
|
22.8 |
0.0406 |
0.27 |
0.319 |
15.7 |
4.15 |
3.78 |
0.11 |
6.5594 |
0.45 |
0.25 |
1.72 |
9.17 |
1.381 |
4.19 |
5.2315 |
15.8 |
|
26.0 |
0.0426 |
O.01 |
0.042 |
19.9 |
5.35 |
3.72 |
0.02 |
8.1153 |
0.58 |
0.24 |
0.19 |
0.22 |
1.778 |
5.39 |
6.6287 |
20.1 |
|
29.1 |
0.0541 |
0.27 |
0.326 |
21.6 |
4.75 |
4.54 |
0.10 |
7.5679 |
0.36 |
0.24 |
1.67 |
8.67 |
1.579 |
4.79 |
7.1781 |
21.7 |
|
8.26 |
0.0063 |
0.32 |
0.326 |
1.99 |
1.25 |
1.58 |
0.15 |
0.7965 |
0.31 |
0.29 |
2.15 |
9.16 |
0.415 |
1.26 |
0.6607 |
2.00 |
|
6.62 |
0.0033 |
0.37 |
0.370 |
0.26 |
0.71 |
0.36 |
0.18 |
0.0215 |
0.16 |
0.34 |
1.84 |
9.41 |
0.238 |
O.7.2 |
0.0869 |
0.264 |
|
99.0 |
0.0102 |
0.31 |
0.321 |
3.12 |
2.53 |
1.23 |
0.15 |
1.3703 |
0.90 |
0.27 |
1.43 |
12.0 |
0.841 |
2.55 |
1.0383 |
3.15 |
Table 2. Effect of concentration for ligand Orange G (OG) at 0.1 scan rate for 1mM CuCl2 at 19.1⁰C (Cu+1 ↔Cu0).
|
Lx10-3 |
Dc cm2.s-1 x 10⁻¹⁰ |
(-)Epc/2 (V) Volt (V) |
αnac |
Ks (cm..s-1) X10-3 cm .s-1 |
Γ C x10-8 Mol.cm-2 |
(+) Qc X10-5 (C) |
Γ a x10-8 Mol.cm-2 |
(-) Q a X10-4 (C)Coulomb |
Log βj |
βj |
(-)∆G (KJ/mol) |
|
0.244 |
1.18 |
0.2392 |
1.2417 |
1.36 |
2.1373 |
6.48 |
5.8547 |
1.77 |
1.0712 |
11.7830 |
5.9945 |
|
0.477 |
1.02 |
0.2419 |
1.2539 |
1.20 |
1.9387 |
5.87 |
6.4259 |
1.95 |
1.2497 |
17.7714 |
6.9931 |
|
0.699 |
0.896 |
0.2424 |
1.3540 |
1.13 |
1.7792 |
5.39 |
5.8861 |
1.78 |
1.5033 |
31.8675 |
8.4123 |
|
0.911 |
1.17 |
0.2397 |
1.2380 |
1.35 |
1.9905 |
6.03 |
6.0955 |
1.85 |
1.8139 |
65.1610 |
10.1506 |
|
1.11 |
1.09 |
0.2374 |
1.3675 |
1.26 |
1.8766 |
5.69 |
6.0421 |
1.83 |
2.0829 |
121.0331 |
11.6554 |
|
1.31 |
1.06 |
0.2399 |
1.4124 |
1.29 |
1.8062 |
5.47 |
5.9930 |
1.82 |
2.3104 |
204.3756 |
12.9285 |
|
1.49 |
0.982 |
0.2404 |
1.2753 |
1.22 |
1.7039 |
5.16 |
6.9036 |
2.09 |
2.4972 |
314.2204 |
13.9739 |
|
1.67 |
1.16 |
0.2374 |
1.4246 |
1.30 |
1.8151 |
5.50 |
7.6951 |
2.33 |
2.7790 |
601.2465 |
15.5508 |
|
1.84 |
1.02 |
0.2378 |
1.4748 |
1.23 |
1.6685 |
5.06 |
7.0411 |
2.13 |
3.0133 |
1031.1666 |
16.8618 |
|
3.11 |
0..63 |
0.2463 |
1.5380 |
1.21 |
1.2939 |
3.92 |
6.3887 |
1.94 |
4.9354 |
86180.2459 |
27.6173 |
|
4.04 |
19.1 |
0.2408 |
0.5526 |
0.150 |
5.2626 |
15.9 |
4.6934 |
1.42 |
14.7890 |
6.15201x10¹⁴ |
82.7556 |
The cyclic voltammetry analysis data given in Table 1 like the electron rate constant at the working electrode in analysis of CuCl2 alone and other analysis are done in presence of Organe G (OG) . Most of the data given in Table 2 are greater than that given in Table 1 indicating ligand effect of the cyclic voltammograms.All data in Tables 1 and 2 are calculated using equations explained previously in other work [11].
The complex stability constant which measure the strength and power of interaction between CuCl2 and Orange G (OG) is very important. The complexation stability constant(B) for the interaction of CuCl2 with Orange G (OG) forming complex in 0.1M KCl is calculated by applying equation (2) [15-17]. ks the electron transfer rate constant,The surface coverage for the electrode in the anodic part Γ C of measurements and surface coverage of working electrode during the anodic measurements Γ a,quantity of electricity at the working electrode in anodic and cathodic cyclic voltammograms measurements indicate good complexation between CuCl2 and Orange G (OG)[14-18].
(Ep)m-(EP)C=2.303 RT/nF log βc+2.303 RT/nF log (Cx) (2)
Where(Ep)m is peak potential for the metal salt in absence of orange G(OG) and (Ep)C is the peak potential of the complex , R gas constant &Cx is the concentration, solution of metal salt in presence of orange G (OG).
The thermo chemical Gibbs free energy of interaction, salvation of CuCl2 + orange G (OG)
were calculated [18-31] using equation (3).
Thermochemical parameters for complex interactions between CuCl2 with Orange G (OG) prove the stability of the complex formed (Table 1).
All data given in proving the reversible diffusion process of the system under consideration.
∆G= -2.303RT log βC (3)
Conclusion
Reversible diffusion interaction between CuCl2 and Orange (G) was concluded .The stability constants and Gibbs free energies of complex interactions are increased with increase in ligand orange G (OG) concentrations indicating more interactions forming complex in the solutions.The electron transfer rate constant ks, surface coverage anodic (Γa) and cathodic (ΓC) are mainly decreased by increase in orange G (OG) concentration , indicating more complexation. Also, the anodic and cathodic quantity of electrictity around the working electrode during measurement is increased with increase orange G concentration due to the complex formed.
Acknowledgments
Thanks to Prof. Dr.Mamdouh Abdel Mogib head of Chemistry Department , Mansoura University fr facilitating the co-operation between Mansoura University and Damietta University.
Disclosure Statement
No potential conflict of interest was reported by the authors.
)